Which are the elements of the best infographic and how to create infographics? I have been fascinated by infographics for a while, then I thought I would like to try my hand and create one myself. Even if I am not exactly a visual person, I am a great fan of the written word primarily, infographics are the exception to the rule in my case. I am not a professional designer, I am just a person with a sharp aesthetic sense. Back to the initial question, let’s explore a bit.
Disclosure: This article may contain affiliate links. If you decide to make a purchase using one of these links, I’ll make a small commission without impacting the price that you will pay. I recommend just services or products I find useful and that I have tested or currently use.
All infographic makers preach that their tool helps you build an infographic in 15-30 min, well, this is an exaggeration, only if you want to gather some elements or you are just referring to the final stage of putting together the design for the infographic, otherwise is far from being that simple.
Let’s Make Your SEO & Content Work Better for Your Business
In my adventure of finding a good infographic tool I tested several free infographic makers and here is what I discovered:
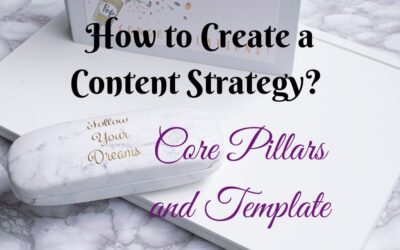
Visme is a reliable tool to create the infographic you desire, the best infographic. There is a decent collection of free infographic templates from which you can pick up one that fits your taste, or you can create your own from scratch. You have the option to download for free the infographic created at a decent resolution.
Their distinctive advantage is the possibility to insert animations and make interactive infographics. If you share your infographic as a URL your visitors will be able to see these animations.
Source: Visme
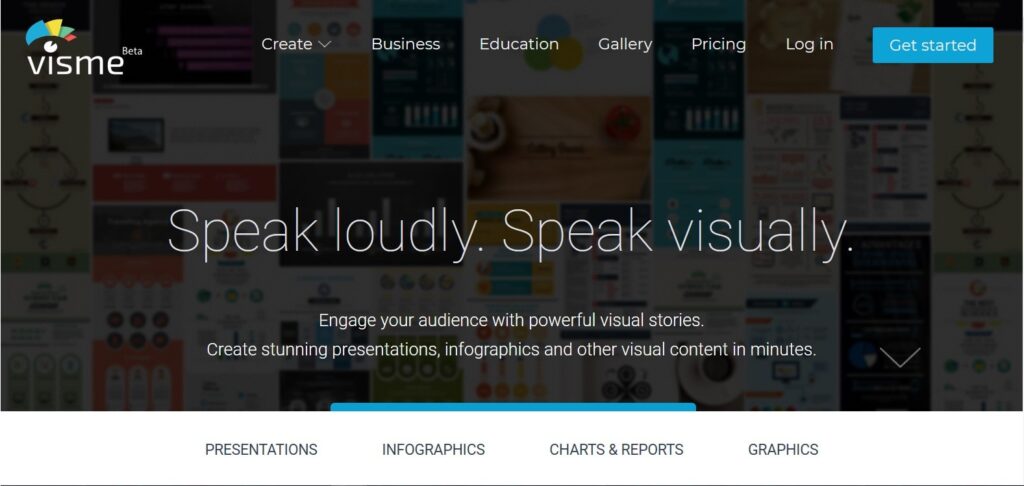
Canva is among the most popular tools for design and free infographic makers, if you are not a professional designer. Among its capabilities counts infographic designing. They put at your disposal a large collection of free infographic templates, the largest among the applications I tested, infographic examples, a plethora of fonts, and more than one million images. It has a well-organized and intuitive interface. You have the possibility to download your work in several formats or share it.
If you want to create your own infographic as a beginner, this is the best infographics maker to start with and you have a pretty good chance to create an appealing design.
Source: Canva
Piktochart is also a good infographic tool, it has a rich collection of free infographic templates to choose from, updated weekly. You can make your own infographic from scratch or use built-in blocks, icons, charts, maps, and an extended selection of photos. You can download your creation as PDF or embed it into your site or as slide show.
Source: Piktochart
And beside some good infographic tools, I also came up with one that succeeded the exploit of offering me one of the most unimpressive user experiences I had in years. I refer to Venngage, despite having a decent template collection and infographic examples, they provide some poor client service and use some misleading advertising.
They claim it’s free to test their services, when in fact it’s not, it’s impossible to export or share an infographic if you don’t have a paid subscription. And they also have various limitations, like the number of items you can upload. All in one, an infographic maker app I will not try again any time soon.
That our brains process better images, it’s not a secret anymore. And this is one of the reasons that explain the success of infographics, as they are visually interesting content marketing pieces that interpret in a simple and digestible manner, complex concepts or data sustained facts. “Publishers who use infographics grow in traffic an average of 12% more than those who don’t,” says HubSpot. It’s a differentiation element that most often stands out.
And in many cases, infographics generate lots of buzz, like these study cases about infographic ROI from Vertical Measures. Or this one from MobileCause which generated over 700 leads.
Here is an infographic that reveals why infographics work.
Anyway, simply gathering together some data and some images will not guarantee the success of your infographic. You want the best infographic you can create to appeal to your audience. There are some tips on how to create infographics online, and some steps to create the best infographic that you should carefully follow, to see valuable results and return on investment.
Keep reading:
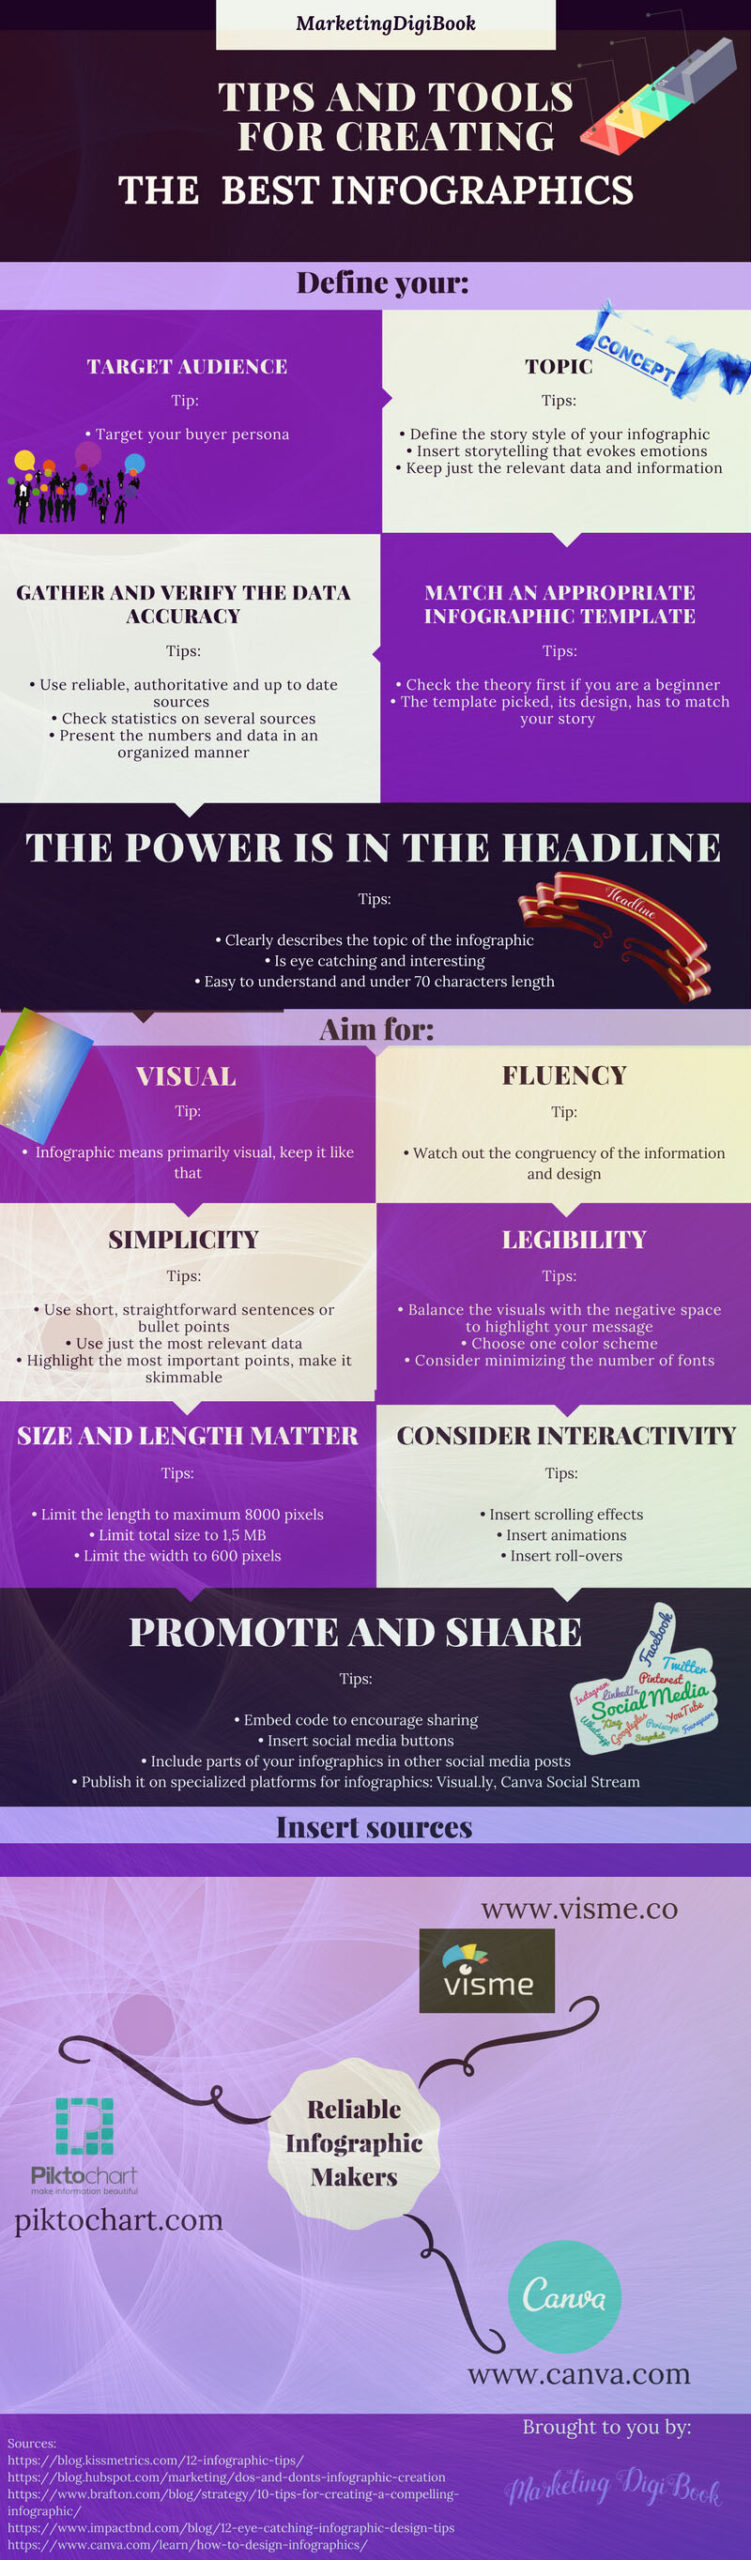
Define the Target Audience for Your Infographic
To obtain the best possible results from your infographic, make it specific, tailored, and personalized to your buyer persona’s interests and needs. Your infographic should be relevant to your target segment, not to the whole world.
The highest value leads, the highest traction, attention, and even virality, will be generated by your target audience. Conceive a creative format that will resonate with your audience.
Relevant tip to make your own infographic:
Target your audience
Define the Topic, the Subject of Your Infographic
Choose a topic that resonates with your audience, and that raises her interest. If it’s possible to be a trending story even better.
Your infographic should have a compelling central idea, and be coherent and attention-grabbing from the very beginning. Its primary purpose is to educate and inspire.
Relevant tips:
Define the story style of your infographic – serious, surprising, funny, exploratory
Insert storytelling that evokes emotions, not just numbers and data
Keep just the relevant data and information
The Power is Hidden in the Headline
The headline makes and breaks. If your headline is not powerful enough, your infographic won’t be viewed. As simple as that. In fact, your title should be brilliant, or close to it.
Relevant tips to create your own infographic:
Clearly describes the topic of the infographic
Is eye catching and interesting.
Easy to understand and under 70 characters length.
Match an Appropriate Infographic Template
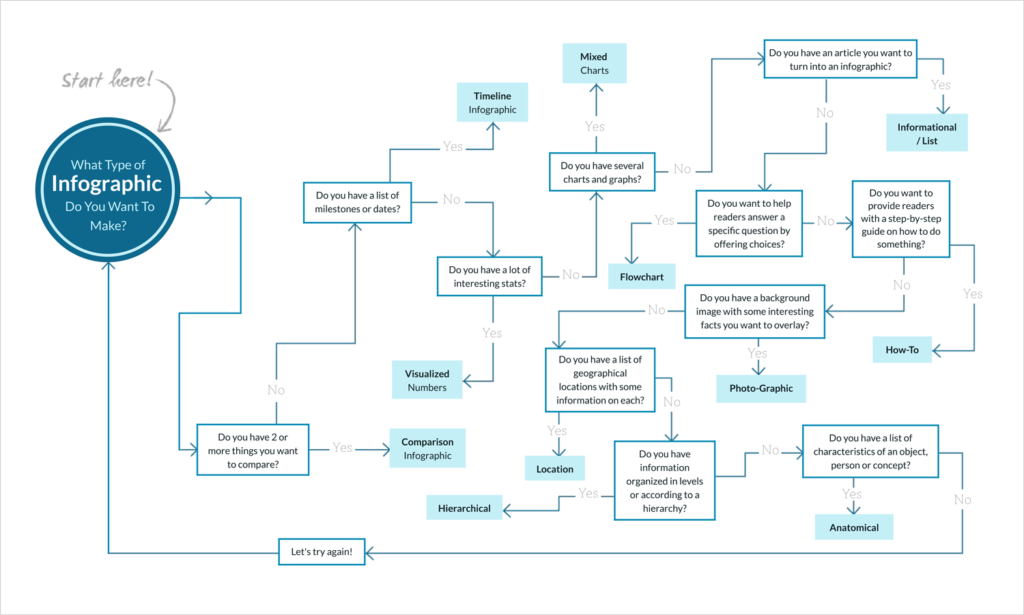
Best infographic types scheme. Source: How to make an infographic?
The template and the format you choose for your infographic need to be fit for its idea and story. And should help you adequately convey the main idea to your audience. Infographic makers offer a variety of customizable templates, take your time and choose one that best matches your infographic story. If you want to help your readers answer a certain question by offering various options, you will choose a flowchart, not a “how to” template.
Relevant tips:
Do your homework and check the theory if you are a beginner. Take a look at a types of infographics presentation.
The template picked, its design, has to match the story you want to tell. If your infographic speaks about great achievements, having a dark crusty background is not exactly the best option.
Personalize the template you choose according to the purpose of your infographic
Gather and Verify the Accuracy of Your Data
The major advantage of infographics is that they present data and numbers in an attractive and interesting way. If your infographic presents many numbers and figures, it is worth to double check them.
Relevant tips for best infographics:
Use reliable, authoritative and up to date sources for your data
Check statistics on several sources
Present the numbers and data in an organized manner
Aim for Simplicity
As always less is more. A minimalist approach is most often the best way to create your infographic. The scope of infographics is to stylize complex ideas into simple visuals. So, just keep it succinct if you want to impress, and focus on just one point without confusing concepts, jargon, long text, or loads of data.
Relevant tips for best infographics:
Use short, straightforward sentences or bullet points
Use just the most relevant data
Highlight the most important points, make it skimmable
Aim for Visual
Infographic means an emphasis on visual pizazz. Don’t clutter it with too much text. Find the right balance between the two, but keep the written info to the minimum. Embed your infographic with attention-grabbing images to make your data more interesting and engaging.
Relevant tip for best infographics:
Infographic means primarily visual, keep it like that

Visuals are the first vector of sales.
Use Professional Styled Stock Photography to Promote Your Business.
Aim for Legibility
An infographic is a sublimation of best practices in design. Negative space is important for the balance of your infographic layout. Effective infographic design is fluent and pleasant for the eye, not a noisy conglomerate of visuals.
Relevant tips for best infographics:
Balance the visuals with the negative space to efficiently highlight your message
Choose one color scheme with a few colors and keep it that way
Consider minimizing the number of fonts used, one maximum two should be enough
Aim for Fluency
An effective infographic matches perfectly the design and the cognitive information. They must flow and combine harmoniously to convey the fluence of the infographic and smoothly drive the viewer through the thought process. The best infographics tell a good story, completed by a great graphic design.
Relevant tip for best infographics:
Watch out the congruency of the information and design, their fluency
Consider Making Your Infographics Interactive
Visuals are an essential learning tool, no doubt about that. But it’s also true that kinetic learning is more powerful, humans retain better while executing an activity. Thus, adding interactivity to your infographic should increase its effectiveness. It may offer control to the user and provoke imagination in ways that a static infographic is just not capable of.
Add scrolling effects to spice up the users’ experience and together with animations to engage them further. This interactive infographic is a great example. Other options to make users involve and participate are to insert roll-overs or clicks to discover supplementary information. Or to insert their own data, like in this already famous infographic comparing your revenues to those of John Paulson. It’s a great infographic idea, and also great to destroy your day, duh! (Do yourself a favor and don’t try it when you have a bad day.)
Relevant tips for best infographics:
Insert scrolling effects
Insert animations
Insert roll-overs
Size and Length Matter, So, Keep an Eye On
Infographics during the publishing process might suffer resizing, verify that the readability is not damaged. The smallest fonts need to be visible without effort.
Infographics are meant to be long, but too long means losing your audience on the way. Users might have a slow connection, and a heavy file translates into a poor user experience.
Relevant tips for best infographics:
Limit the length to maximum 8000 pixels
Limit total size to 1,5 MB
Limit the width to 600 pixels
Insert Sources
If you are relying heavily on data in your infographic, citing sources is a must. It will generate trust and authority for your infographic. You can cite the sources at the end of the infographic or even within its body if that doesn’t disturb the general flow.
Promote and Share Your Infographic
Infographics don’t become viral and popular by default, they need promotion. You know the dictum “a piece of content marketing means 20% creation and 80 % promotion”, infographics are no exception. As a consequence you need to share your infographic on social media, data say infographics are three times more shared on social media platforms than other content marketing types. Publish it on your site, insert social sharing buttons, reach influencers in your niche and ask them to spread the word, and ask your audience to share it.
Relevant tips for best infographics:
Embed code to encourage sharing
Insert social media buttons
Include parts of your infographics in other social media posts
Publish it on specialized platforms for infographics: Visual.ly, Canva Social Stream
Since visual content marketing is gaining momentum, infographics are still raising interest and bringing results. Not to mention they are a great way to stand out and engage your audience.
And these days is really possible to create outstanding infographics without being a designer, just by using a reliable infographic maker tool and respecting the tips for the best infographics listed above. Have you discovered any other tips or tools that you would like to share?